Final Peak Detection Graph (2013)
Peak detection now working with a set threshold for each sensor. When the incoming sensor value is above the set threshold, the highest pressure value is continuously recorded. As soon as the sensor goes bellow the threshold value, the highest pressure value is taken to be the peak and a line is drawn between this new peak and the previous peak.
Processing code >> http://web.media.mit.edu/~plusea/downloads/code/BoxImpact_PeakDetect.zip
Comments:
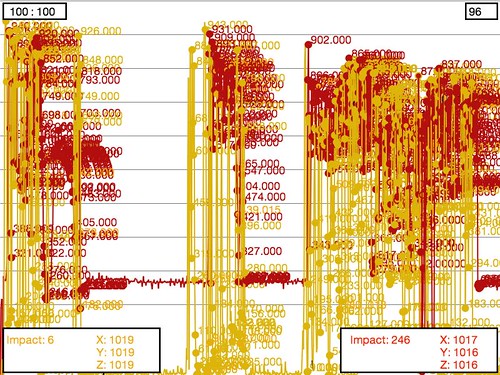
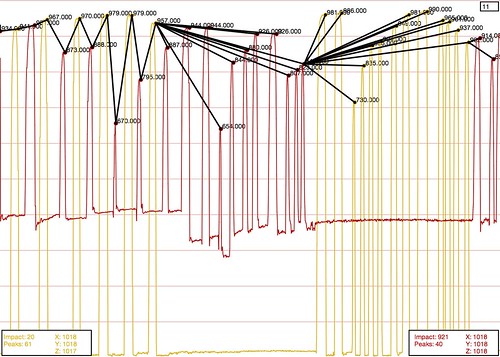
– In the top right corner of the application window a counter counts down from 180 seconds (3 minutes) and resents itself when it reaches 0.
– In the bottom left and right corners the following left/right values are printed:
– – incoming pressure sensor (impact) value
– – number of peaks (pressing “r” resets this count)
– – incoming sensor values from the x, y and z axis of the accelerometer
– Run the graph and look at the incoming pressure sensor values and set the thresholds accordingly, by editing them in the code. You want the threshold for either sensor to lie well above it’s resting/relaxed state, yet bellow the minimum pressure amount coming from an impact.
– When the graph hits the end of the window and screenshot of the application window is stored to the code file.
– Pressing the “space” bar at any time will take a screenshot of the application window and store it to the code file.
– Pressing “r” at any time will reset the peak count of how many times either sensor has peaked.
Video of peak detection working
Link >> http://youtu.be/OQOL3lhgOWA
Screenshots of running peak detection.
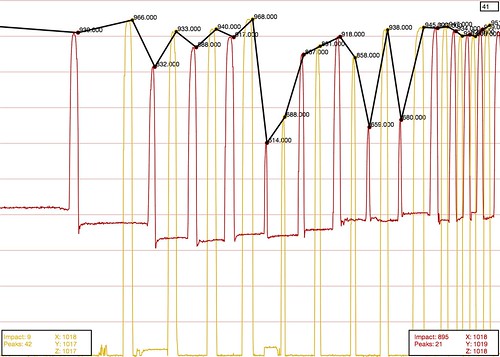
Thresholds should be adjusted to the sensor range. If the sensor is pressured to cause multiple peaks, but does not recede bellow the threshold value then the highest value will be recorded as the peak. If the threshold is set too close to the relaxed sensor state then this will result in multiple peaks triggered by the noise of the sensor.
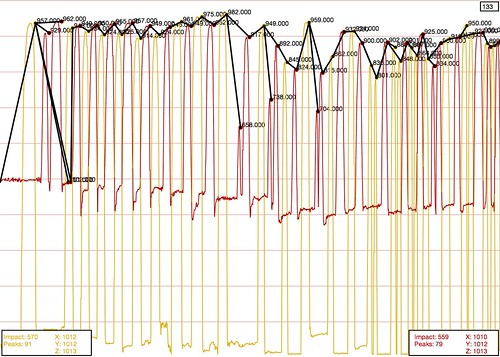
If one of the sensors is triggered multiple times in a row, the line connecting peaks will branch out as shown here:
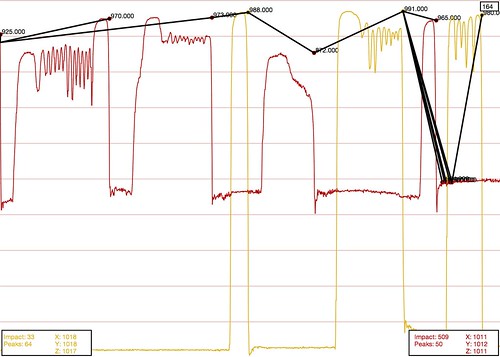
Peak detection gone crazy: