Plusea

autodesk revit architecture 2012 autodesk autocad mechanical 2009 autodesk vred professional 2023 autodesk cfd 2019 autodesk building design suite ultimate 2018 autodesk autocad mechanical 2024
Just another WordPress weblog

+c
calendar
publications
contact
everything
in process
2023
2022
2021
2020
2019
2018
2017
2016
2015
2014
2013
2012
2011
2010
2009
2008
2007
2006
2005
2004

walks

PLAYING TOGETHER
BECOMING MATERIAL
A WEARABLE STUDIO PRACTICE
ANATOMY OF A PIN
MAKING AS A MEANS OF EXPLORING
MAKE YOUR TECH AND WEAR IT TOO
MAKE TOOLS, NOT PARTS
TRACES WITH ORIGIN
ROOM FOR SPACE
COMMISSIONS

weeds

TEACHING
WRITING
KOBAKANT
How To Get What You Want
A Kit-of-No-Parts
Tools We Want
A Wearable Studio Practice
Swatch Exchange
mi.mu + dev blog
Mastodon
Flickr
YouTube
Riot
Instructables
GitHub
Diaspora

Graphs (2013)

Working on Graph

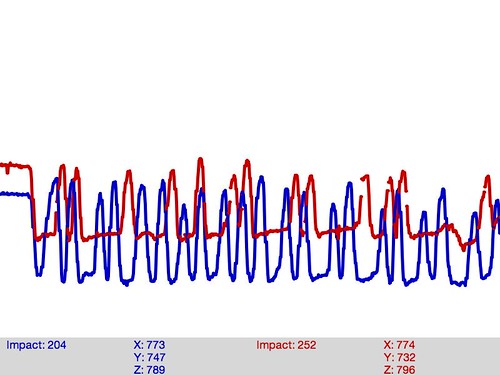
The following Processing test code, generates fake sensor input and draws two graphs (one for each glove) with peak detection. Still working on getting peak detection working well and on merging the two graphs to one.
Download test code >> http://web.media.mit.edu/~plusea/downloads/code/BoxingImpact_testwithfakeinput.zip
Screenshot from testing
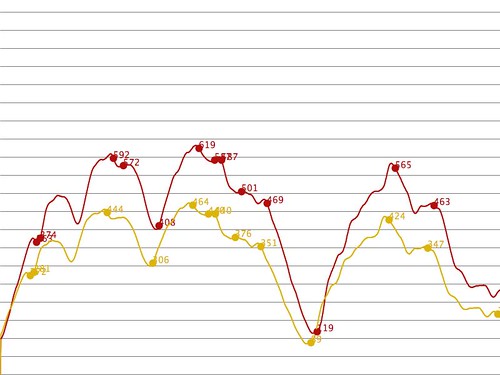
Two-in-One Graph

Sketch by Steven:

Thresholded Graph

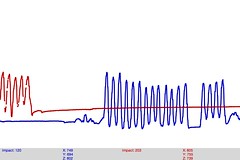
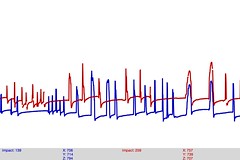
The following screenshots show the graphed pressure sensor values from both gloves. Minimum pressure thresholds can be set for both gloves individually to adjust them to the initial pressure of being worn. This means that the graph will not start to draw until this threshold is met and that this threshold constitutes the bottom graph value for both gloves.

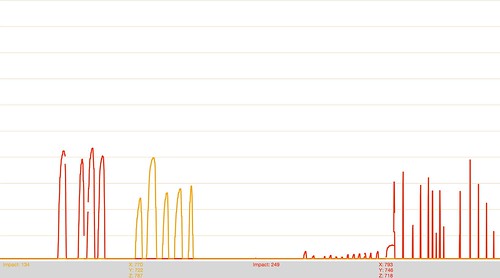
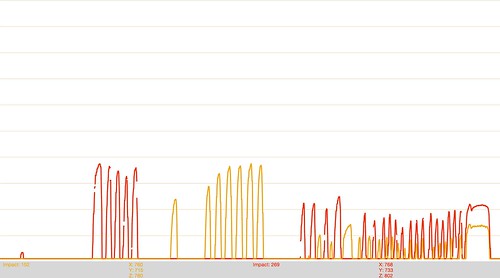
Screenshots from the Application

Red = Right, Blue = Left


Plusea is proudly powered by WordPress